Predicting Panama Canal waiting times with integrated climate data

The Panama Canal, a crucial waterway for international maritime trade, often experiences varying waiting times for vessels due to its high traffic and limited capacity. Researchers are now developing a prediction model which makes it easier to estimate the waiting time before going into the canal.

13 000 vessels transit the Panama Canal every year. To avoid delays, ships can reserve transit slots in advance through a booking system. Those with reservations generally have shorter waiting time compared to those without. However, the water levels in the artificial Gatun Lake, that constitutes part of the canal and serves as a water source in the region, also influences the waiting time.

Gatun Lake. Photo: Adobe Stock #335329721
Gabriel Fuentes


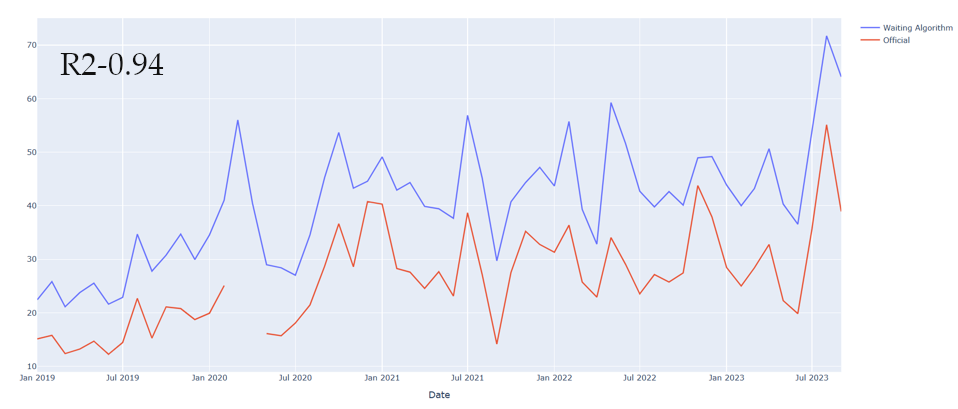
In a Climate Futures research project, Assistant Professor Gabriel Fuentes at NHH the Norwegian School of Economics has together with shipping company Western Bulk and Associate Professor Ziaul Haque Munim studied if the lake levels are good predictors of waiting times at the canal. Other factors that affect waiting time are e.g. queues and combination of waiting vessels, meteorological events, such as the cyclone season and propagation from congestion from other ports.

El Niño changes transit pattern
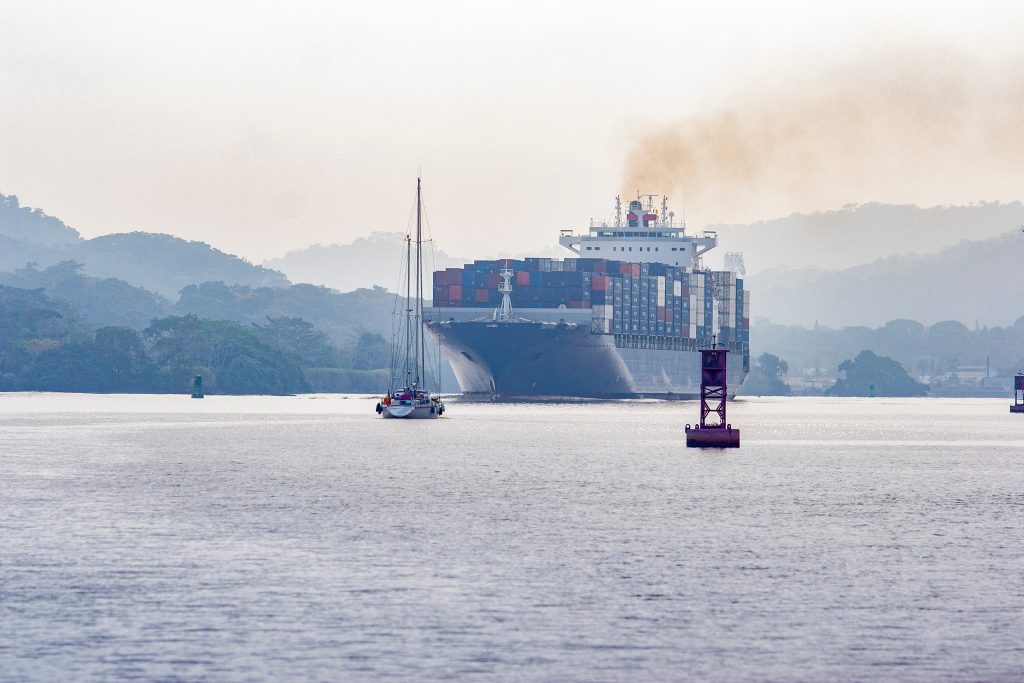
In 2023 the El Niño climate pattern caused the worst drought in over 70 years. During El Niño, fewer vessels cross the canal, and more vessels reserve their transits, thus enhancing efficiency.

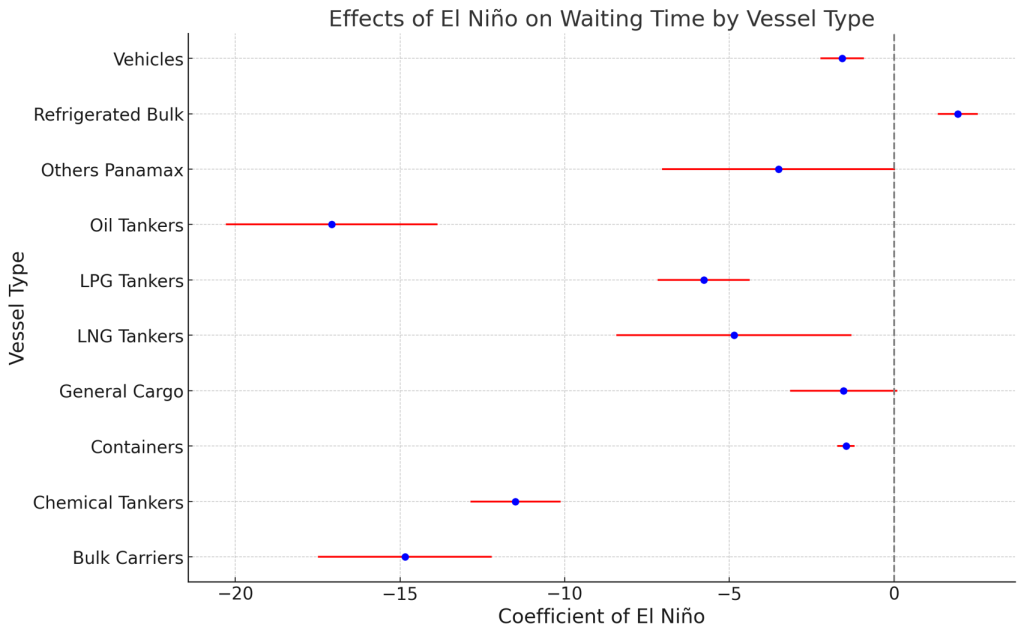
– Despite the widespread belief that canal constraints have led to longer waiting times, our findings indicate the opposite. Specifically, El Niño is associated with reduced waiting times, Fuentes says.

However, these results do not imply that El Niño is beneficial for the canal overall; rather, they suggest that El Niño creates a more selective passage for vessels, favouring those willing to pay extra for a reservation. This is disadvantageous for companies associated with Climate Futures, whose market segment (transport of industrial commodities) relies on transporting cargo at lower costs. Therefore, paying for reservations is not competitive for them.

Figure 1. Bulk carriers transits per week In this figure we see the drop in transits per bulk carriers, market segment from two of our partners (G2Ocean and Western Bulk). The reason was that in order to pass without delay they were forced to pay a reservation. If it didn’t pay off (cost wise) they decided to avoid the Canal through a longer route via Cape Horn or Drakes Passage (South of Chile/Argentina)

Transits were reduced to 18 ships a day in January and the numbers are now starting to grow following an increase in rain the last couple of months and the prospects for the next months. On normal times the Canal could handle from 36 to 40 transits a day.

Connection between climate change and the Canal
This study, along with research by Cai et al. (2018), establishes a connection between climate change and the Canal. Cai et al. reported that greenhouse warming might lead to more variable El Niño patterns in the Eastern Pacific, increasing the likelihood of extreme El Niño events.

– Given that our research highlights El Niño’s impact on the Canal, we can infer that extreme El Niño conditions might significantly affect the Canal’s operations. Considering that the Canal facilitates approximately 6% of global trade, any reduction in transit or cargo volumes could have ripple effects on the global economy. Regarding the recent drought events, it is important to note that according to a study featured by Zhong (2024) in the New York Times but not yet published in a journal, while the drought was linked to El Niño, it may not have been directly caused by climate change, Fuentes explains.

Machine learning models
The researchers have estimated waiting time by using machine learning models to analyze the ships AIS-data. The last three years the average waiting time was 35 hours, but not all types of vessels have the same waiting time.

Figure 2. Waiting times Algorithm performance. In this figure we compare our algorithm that estimates waiting times with AIS data and machine learning with the official statistics of the Panama Canal. With a fit of 0.94 it indicates that our algorithm is capable of measuring the underlying information with great accuracy.
Figure 3. Marginal Effects of El Nino per vessel/market segment In here we measured what is the effect of El Nino per market segment. We can see that for some markets it reduces quite significantly the waiting times. This is connected to the initial argument. El Nino reduces the queue of vessels and force vessel to reserve transits in advance.

The researchers found that the El Niño Southern Oscillation signal, measured via the Oceanic Niño Index (ONI), is a better predictor of Canal efficiency than the Gatun Lake water levels:

– Our conclusion is based on relationships identified in early experiments of the study. Specifically, when ONI levels indicate changes, and rainfall projections are adjusted accordingly, the Canal administration can signal to its customers potential restrictions. On response the customers may reserve transits while others may decide to deviate and don’t cross the Canal. These restrictions are typically communicated to the market 4 to 6 weeks in advance, as evidenced in our study, Fuentes concludes.

References

Cai, W., Wang, G., Dewitte, B. et al. Increased variability of eastern Pacific El Niño under greenhouse warming. Nature 564, 201–206 (2018). https://doi.org/10.1038/s41586-018-0776-9

Zhong, R. (2024). Drought That Snarled Panama Canal Was Linked to El Niño, Study Finds. The New York Times. https://www.nytimes.com/2024/05/01/climate/panama-canal-drought.html